Reporter tutorial: pivot reports
Pivot reports are a special kind of summary report that allow for the aggregation of data along two dimensions, such as counts by Shop and Status.
Pivot reports can also be used to present time periods in logical date aggregations (monthly, quarterly, etc.).
This tutorial provides two lessons, each of which walks you through the steps of building an example pivot report. Since pivot reports are easy to define and quite powerful, it is often best to define summary reports as pivots first! If your report cannot be defined as a pivot, refer to the Advanced Reporter Tutorial for guidance in creating a Summary Report.
Pivot Report Definitions
When defining a pivot report, you want to first determine the fields on which the pivot report will be defined:
- Row Definition: Field that will be displayed as rows in the pivot table report. This is typically a text field, such as Shop, Priority, or Problem.
- Column Definition: Field that will be used to aggregate columns of data. This can be a text field or an aggregation of date data.
- Summary Calculation: Field that will be calculated or aggregated by the defined column and row. The summary field needs to be numeric (unless you are performing a count aggregation). If you are performing a count, be sure to select a field that is always populated (such as Work Order# or Requested)
For our first example, let's create a pivot report that provides a count of closed Work Orders by Work Order Type and Priority. Our definition will be as follows:
- Rows: Work Order Type
- Columns: Work Order Priority (Description)
- Summary: Count - Using WorkOrder# as the field to count, as this field is always populated
To define the setup for the pivot report:
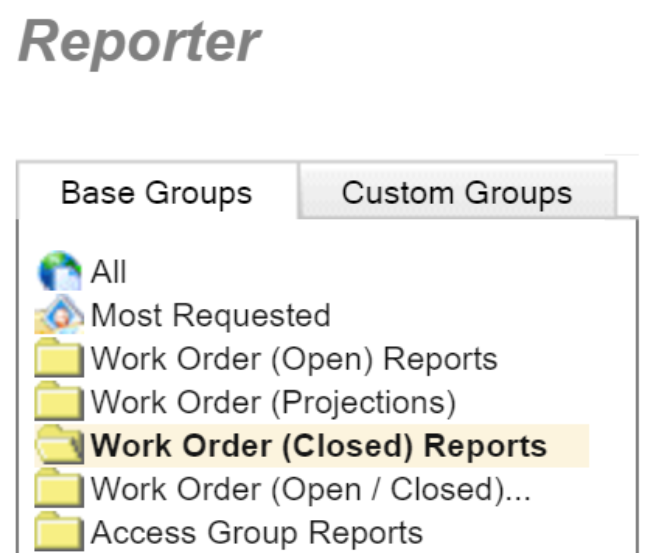
- Open the Reporter and select the Work Order (Closed) Reports folder.
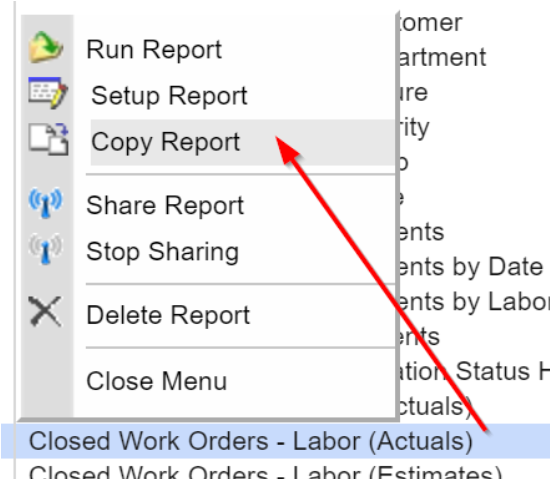
- Locate the Closed Work Order Count by Priority report and select Copy Report:
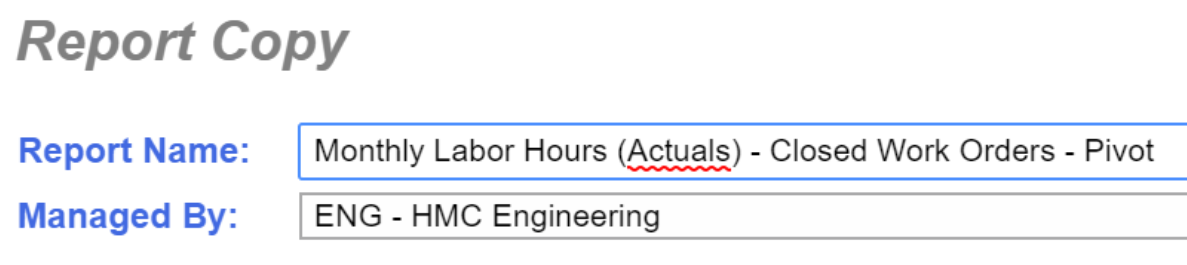
- The report will open in the Report Copy window. Enter a descriptive name for your report, such as the following:
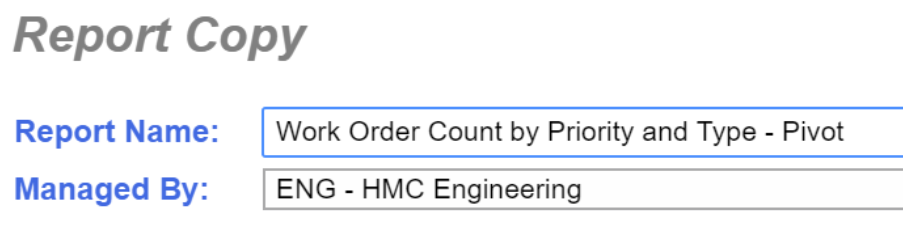
- Specify a Repair Center in the Managed By prompt if the report should only be viewable by a particular Repair Center. To make the report viewable by all, select All Repair Centers. The logged in user's Repair Center will be shown by default.
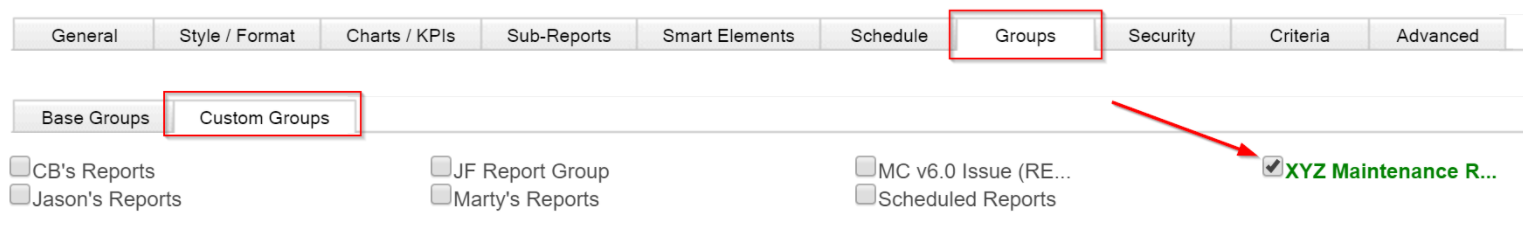
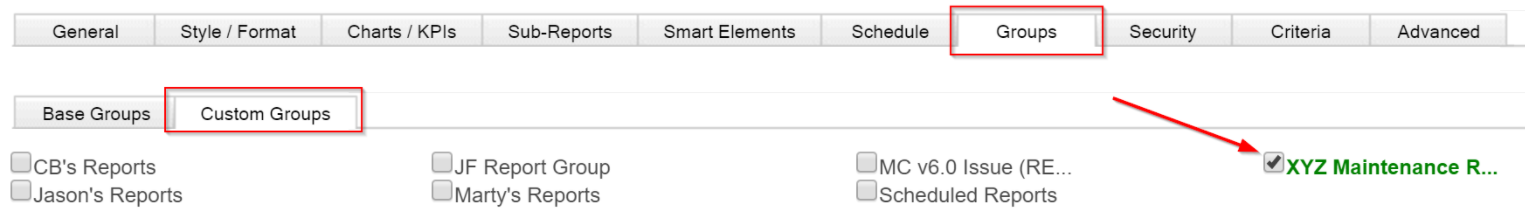
- Click on the Groups tab and then select the Custom Groups sub-tab. Place this report in your custom report folder by selecting the desired Report Group:
- Click Apply when you are finished to return to the Report Lookup.
- Once back to the Report Lookup, locate your newly copied report and click Run Report.
Note: The report should be in the Work Order (Closed) Reports Folder, as well as your Custom Report Group.
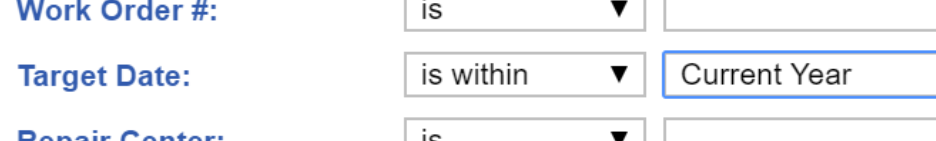
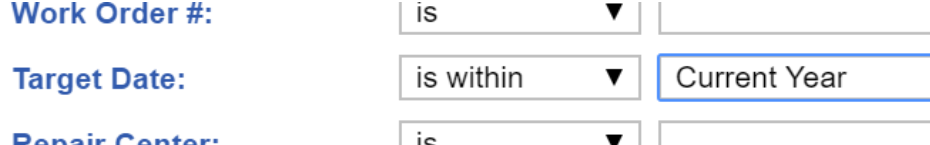
- In the Report Criteria dialog, change the Target Date filter as desired. For example, you could include all work orders that were targeted in the current year. If it is early in the calendar year, you may wish to change this to a broader filter to ensure sufficient records are included:
Note: When reporting against closed Work Orders, customers often prefer to base report criteria on the Work Order completion (WO.Complete) date. Refer to the Intermediate Reporter Tutorial for instructions on adding fields, such as Completed Date, to the Report Criteria window.
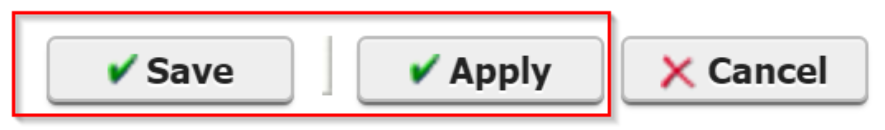
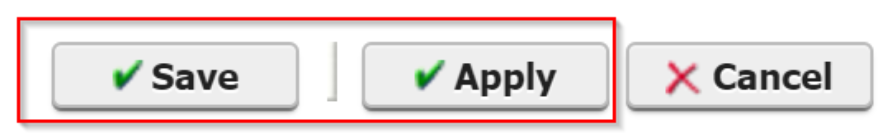
- Click the Save button at the bottom of the Report Criteria dialog and then click Apply to run the report. The report will display in the Report Preview window:
- Click the Setup button to modify the setup for this report:

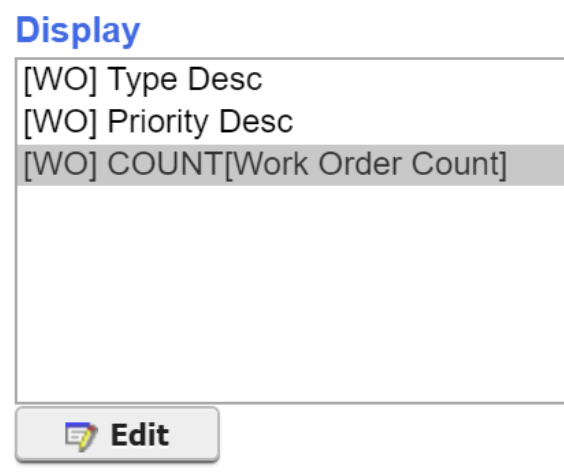
- The Report Setup window will display, showing the fields currently defined for the report in the Display fields list on the right. Ensure the Display fields list includes only the following fields: [WO] Type Desc, [WO] Priority Desc and [WO] Count
- Ensure the fields are listed in the same order shown in this screenshot:
- Highlight the first field in the Display fields list (Type Desc) and click Edit to access the Report Field Options dialog for this field. This will be the defined row for the pivot report.
- In the Pivot Setup field prompt, indicate Row and click Apply:

- Highlight the second field in the Display fields list (Priority Desc) and click Edit to access the Report Field Options dialog for this field. This will be the defined column for the pivot report.
- In the Pivot Setup field prompt, select Column. A new control will appear prompting you to specify how the column should be defined.
- In the Columns Defined Using field prompt, use the default Field Data value, as we want the values for priority description to display as columns. Then, click Apply:

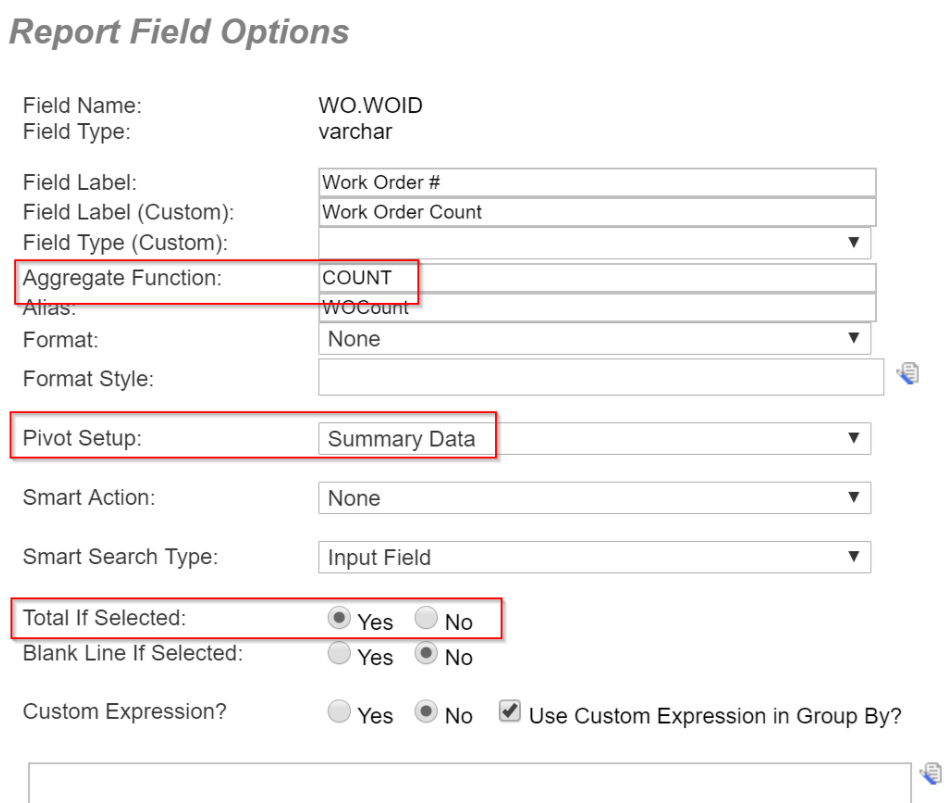
- Highlight the third field in the Display Fields List (WO Count) and click Edit to access the Report Field Options dialog for this field. This will be the defined summary calculation for this pivot report:
- Verify that the correct Aggregate Function to be performed is specified (COUNT).
- In the Pivot Setup field prompt, indicate Summary Data.
- Verify that the column is set to Total if Selected.
- The dialog should be set up as shown. Click Apply:
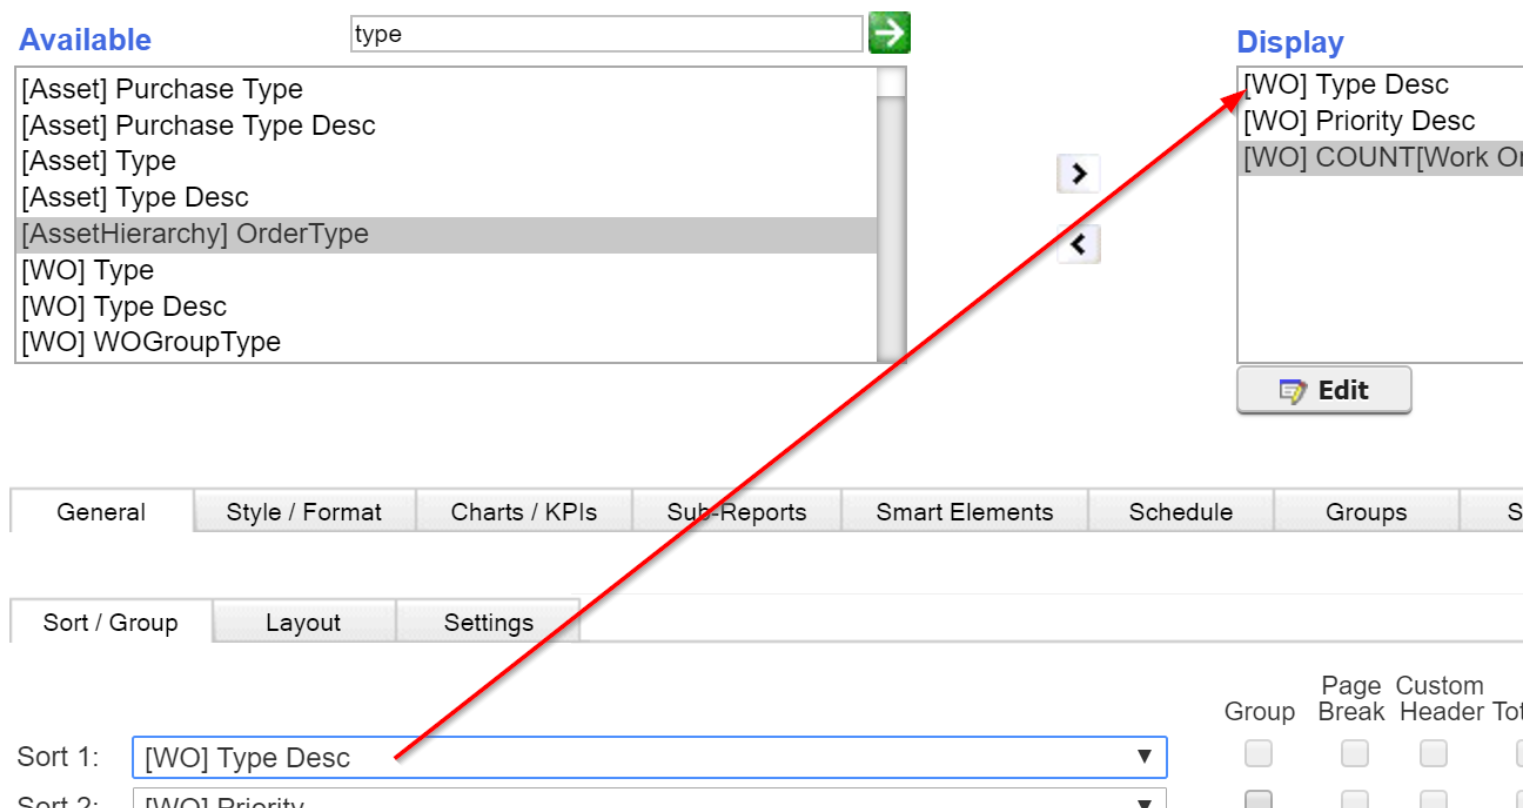
- Access the General>Sort/Group sub-tab and change the first sort field to match the first field identified in the Display field list (Type Desc):
- Remove any additional sort definitions (there should be only one sort defined).
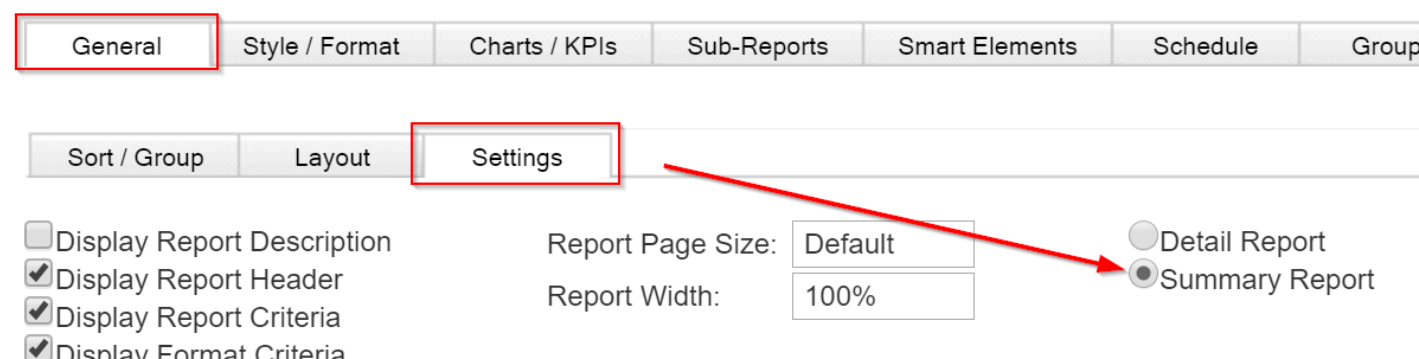
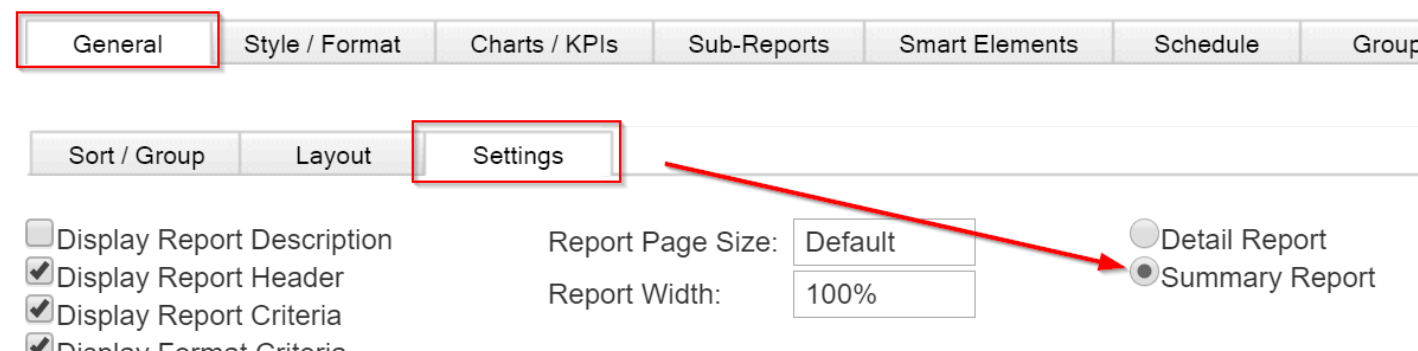
- Access the General>Settings sub-tab and verify that the report has been specified as a Summary Report:
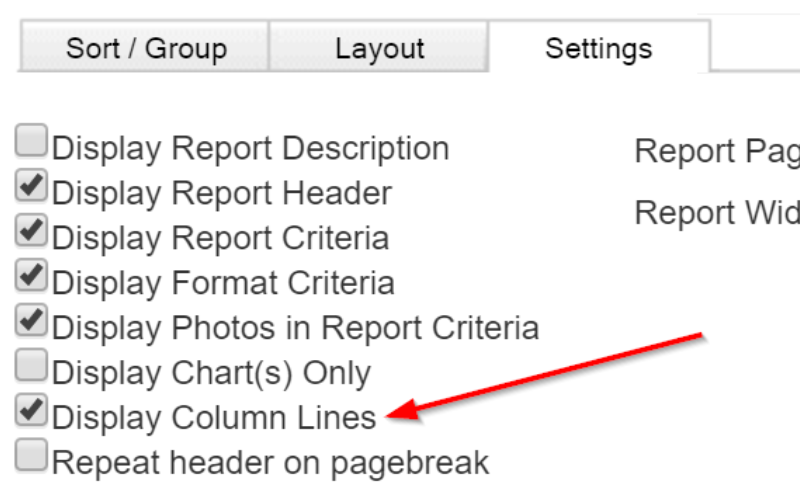
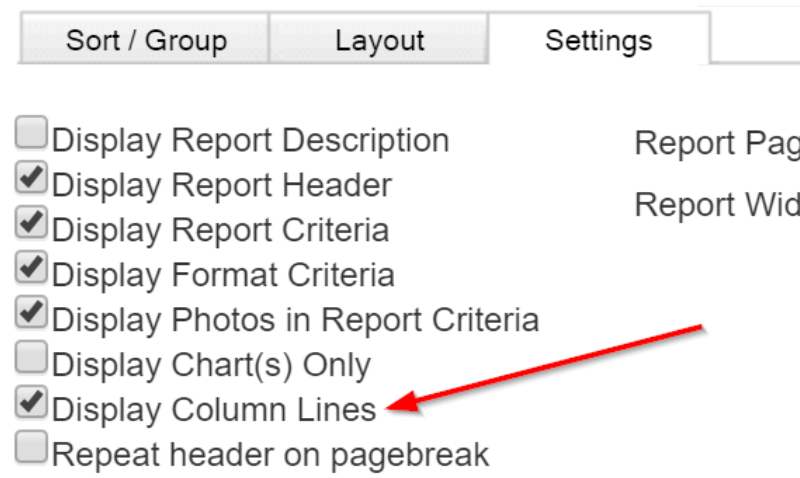
Tip: Some customers like to use the "Display Column Lines" indicator on the General>Settings sub-tab to display the report in a grid:
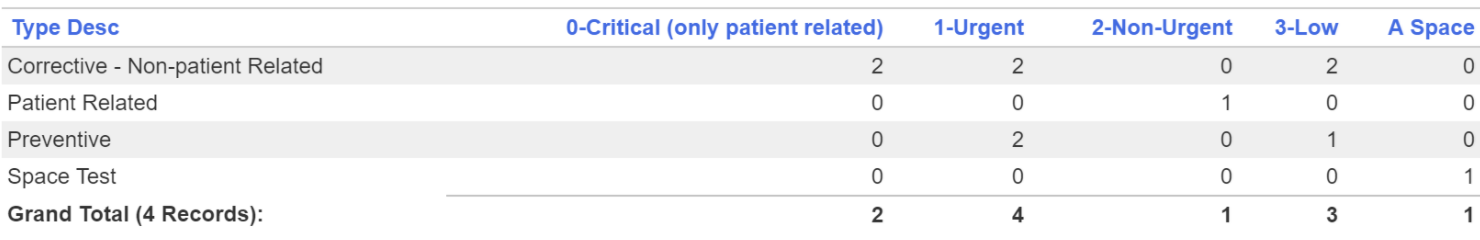
- To save your changes and view them in the report, click the Apply button at the bottom of the Report Setup window. Your report should display, listing a row for each work order type and a column for each priority in place at your organization:
For our second example, let's create a pivot report that provides a summary of hours worked on closed Work Orders in the current year, aggregated by Priority and Month.
- Rows: Work Order Priority
- Columns: Work Month (based on WorkOrderLabor.Date)
- Summary: Sum - Total Labor Hours
Since we will be reporting against Labor Actuals, it is important to select a report from the Work Order (Closed) Reports Group. This will ensure the report has been defined to include the correct type of data.
- Return to the Report Lookup, select the Work Order (Closed) Reports Group, and search for a report that will include Labor Actuals. For example, highlight the Closed Work Orders - Labor (Actuals) Report and select Copy Report:
- The report will open in the Report Copy window. Enter a descriptive name for your new report, such as the following:
- Specify a Repair Center in the Managed By prompt if the report should only be viewable by a particular Repair Center. To make the report viewable by all, select All Repair Centers. The logged in user's Repair Center will be shown by default.
- Click on the Groups tab and then select the Custom Groups sub-tab. Place this report in your custom report folder by selecting the desired Report Group:
- Click Apply when you are finished to return to the Report Lookup.
- Once back to the Report Lookup, locate your newly copied report and click Run Report. The report should be in your Custom Report Group and the Work Orders (Closed) Folder:
- In the Report Criteria dialog, change the Target Date filter to include all work orders targeted for the current year. Exclude any additional criteria defined for the report:
Note: When reporting against Actual Labor on closed Work Orders, customers often prefer to base report criteria on the Work Order completion (WO.Complete) date, or the date the actual labor was performed (WOLabor.Date). Refer to the Intermediate Reporter Tutorial for instructions on adding fields such as these to the Report Criteria window.
- Click the Save button at the bottom of the Report Criteria dialog and then click Apply to run the report. The report will display in the Report Preview window:
- Click the Setup button to modify the setup for this report:

- The Report Setup window will display, showing the fields currently defined for the report in the Display fields list on the right. We need to ensure the fields used to define the row, column and summary calculation are listed. The report that we copied is a detail report, with more fields than are needed for our pivot report. Add and remove fields from the Display fields list as follows:
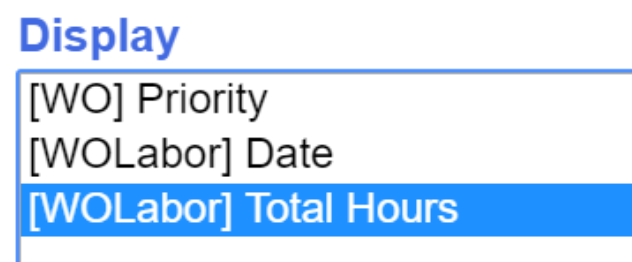
- Ensure the field list includes: [WO] Priority, [WOLabor] Date, and [WOLabor] Total Hours.
- Remove any additional fields.
- Ensure the fields are listed so they appear in row, column, summary order as follows:
- Highlight the first field in the Display fields list (Priority) and click Edit to access the Report Field Options dialog for this field. This will be the defined row for the pivot report:
- In the Pivot Setup field prompt, indicate Row and click Apply:

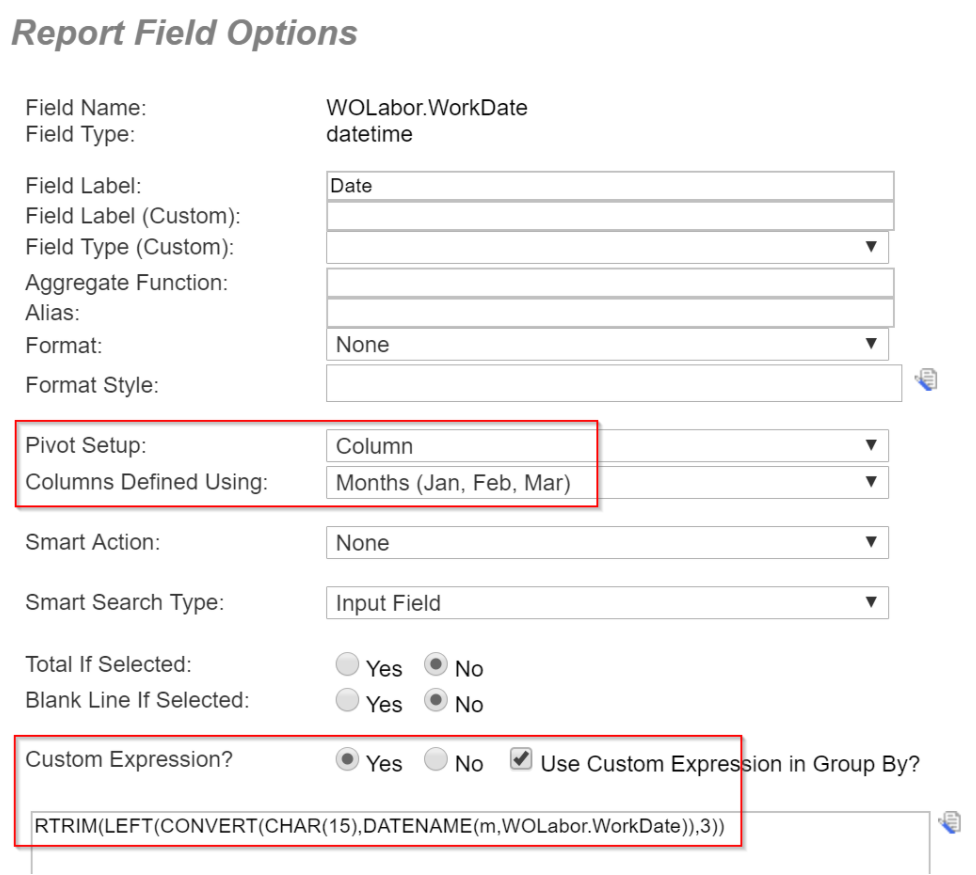
- Highlight the second field in the Display fields list (Date) and click Edit to access the Report Field Options dialog for this field. This will be the defined column for the pivot report:
- In the Pivot Setup field prompt, select Column. A new control will appear prompting you to specify how the column should be defined.
- Select Months (Jan, Feb, Mar). As can been seen, data can be aggregated into quarters, weeks or days of week as well.
- When a DATE function is selected for the Columns Defined Using field prompt, Maintenance Connection automatically places the expression used to create that function in the Custom Expression Box in the bottom of the dialog.
- It is important that you change the Custom Expression? indicator to Yes whenever a custom expression is defined.
- The dialog should be set up as shown. Click Apply:
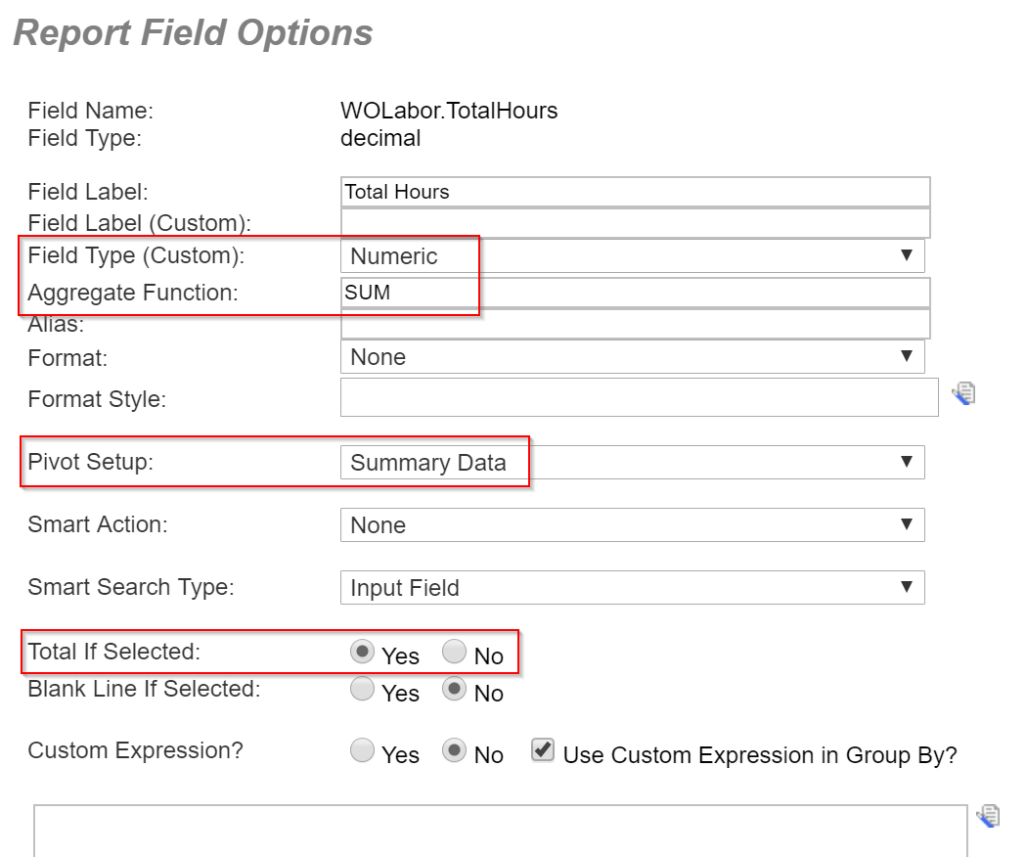
- Highlight the third field in the Display fields list (Total Hours) and click Edit to access the Report Field Options dialog for this field. This will be the defined summary calculation for this pivot report:
- Specify Numeric for the Field Type.
- Enter SUM as the Aggregate Function to be performed.
- In the Pivot Setup field prompt, indicate Summary Data.
- Specify Yes for Total if Selected.
- The dialog should be set up as shown. Click Apply:
- Access the General>Sort/Group sub-tab and change the first sort field to match the first field identified in the Display fields list (Priority). Remove the Group indicator if it is specified:
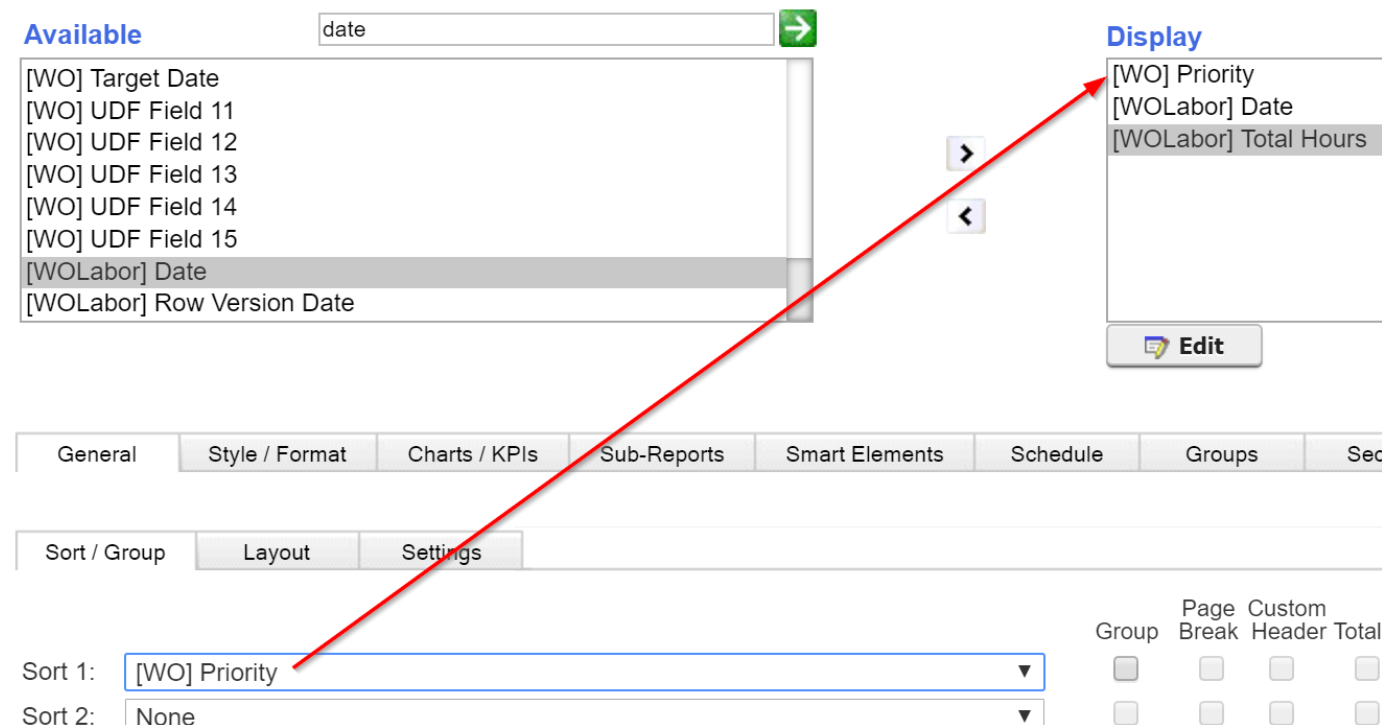
- Remove any additional sort definitions (there should be only one sort defined).
- Access the General>Settings sub-tab and verify that the report has been specified as a Summary Report:
Tip: As mentioned in Lesson 1, some customers like to use the "Display Column Lines" indicator on the General>Settings sub-tab to display the report in a grid:
- To save your changes and view them in the report, click the Apply button at the bottom of the Report Setup window. Your report should display in the Report Preview window. It should be noted that if your organization is in the early stages of implementation, there may be limited actual labor data in the system to report:
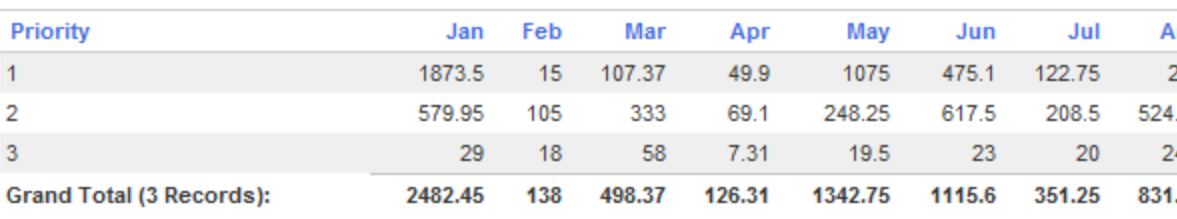
As can be seen from these lessons, pivot reports are an excellent way to summarize data into logical date aggregations. It is easy to shift the presentation by changing the designated row, column and summary fields. For example, you could show labor costs by changing the summary field to WOLabor.Cost, or display quarterly values by changing the date aggregation.
Similarly, changing the row and sort designation could easily provide a different cut of the same data (e.g., by Shop or Category). Now that you have learned the tools to create pivot reports, you can use the reports created in these lessons as a model for other pivot reports that would benefit your organization.
For complete reference information on the Maintenance Connection Reporter, refer to the Online Reporter Guide available from the Help Menu. The following additional Reporter Tutorials are available in our Knowledge Base:
- Reporter Tutorial - Basics: Overview, Copy Report, Report Groups, Report Preview Window, Report Criteria, Field Selection, Sorting/Grouping, Charting
- Reporter Tutorial - Intermediate: Conditional Formatting, Modify Report Criteria, Smart Report Popups, Smart Criteria and Scheduling Reports
- Reporter Tutorial - Advanced: Custom Expressions, Modifying Fixed Criteria, Editable Smart Reports, Custom Group Headers, Sub-Reports, Summary Reports
 Closed Work Order Count by Type and Priority