Downloadable reports for KPIs, dashboards, and reports
This article provides reports that you can install onto your system so that you can view reports related to KPI's, Dashboards, and the Reporter. Select the reports you wish to download and follow the instructions given.
 Audit Report for Smart Report Setup Errors
Errors in setting up Smart Reports can cause serious issues in your database.
Smart Reports offer users the ability to modify records in bulk within reports without having to access those records individually within the Main Application (MRO). Though this is an efficient and time-saving practice, it can lead to serious errors if Smart Reports are not set up correctly. With this possibility in play, it can be helpful to do a self-audit of Smart Reports in order to pinpoint any that were set up incorrectly. This article provides the SQL to build a report in MC that will identify these "bad Smart Reports," and save users from creating bad data with those reports.
Overview of the Report
The primary purpose of this report is to locate any Smart Reports in which Smart Buttons are not matched to the Primary Key of the table indicated in the report, thus identifying the reports that need to be modified before using them to adjust records in the system.
Please keep in mind that this report should be viewed less as a "life-saving" device and more as a raft which makes playing the Smart Report pool more fun. In other words, this report can offer a sense of safety as you proactively explore how to use Smart Reports to their fullest potential, but it is not designed to "rescue" a system whose data has been severely affected by using "bad Smart Reports."
Along the same lines, it is important to note that, because Smart Reports are powerful tools, they should be used with a degree of care that corresponds with their power. If there is ever any uncertainty about how the use of a Smart Report will affect the system, contact your Implementation Consultant or our Support team so that we can help you set up a Smart Report correctly.
Instructions to Download and Install
On Premise: Based upon your company hosting its own database, your IT personnel or someone with server access will need to follow the below instructions:
1) Open the SQL file: Smart_Report_Audit.sql
2) Copy contents into a new Query window in your SQL Server Management Studio (SSMS).
3) Execute SQL script against your MC entity database prefixed with ENT.
Cloud Hosted: Based upon your database being hosted in our Data Center, you will need to make a request through our Support team to install the report.
KPI Trend Comparison Report
One of the benefits of employing a CMMS like Maintenance Connection is the ability to pull information back out of the system and analyze the data. A great way to do that is by taking a look at the trend data gathered over time from your Key Performance Indicators (KPIs). Here, we will discuss the details of creating the KPI Trend Comparison Report. And, please check out the demo video above that shows you how to work through the process described.
Overview
In a typical organization, metrics (KPIs) will be defined for standard data to be tracked. Some of these metrics will likely be consistent across all business units (divisions, departments, shops, shifts, etc.). An example of a KPI which is consistently used to measure performance across all business units might be Work Order Completion Time. Once you've begun tracking the trend data for each business unit, the KPI Trend Comparison Report will allow you to overlay similar data gathered from each unit and see the trend across the entire organization.
Report Highlights
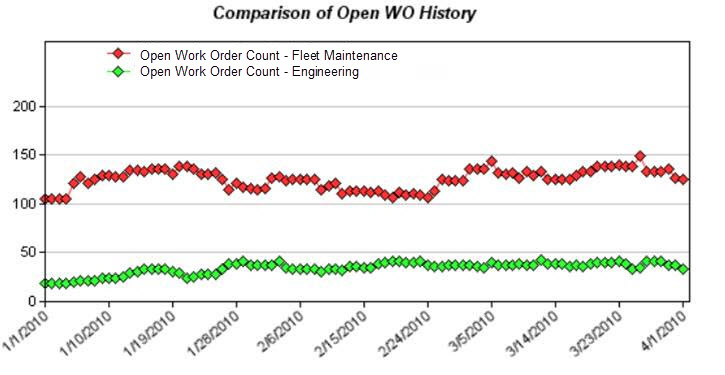
The report is a custom file built by Maintenance Connection, which means that it cannot be altered in any way. Each set of similar KPIs will be displayed on a single graph. For example, your KPIs for Open Work Orders for your Fleet, Engineering and Facilities shops might all be included on a single graph, with separate graph lines through the data points for each shop. Additional graphs are included for each set of KPIs included for comparison.
KPI Configuration
- KPIs: We assume that you have KPIs already configured for your organization and that you have sets of similar KPIs for which comparison would be valuable. If you need assistance configuring your KPIs, contact our training team.
- Trending: We assume that trending is turned on for your KPIs, that your KPIs are configured in such a way that trend data will be displayed in a similar format and that data has been collected over a period of time.
With those expectations satisfied, we can now move onto how to configure your KPIs to work with this report.
- KPI Group: First, you'll need to place all KPIs you intend to compare using this report in the same KPI group. We recommend creating a new group and then cloning the KPIs you'd like to compare and placing the cloned copies in the new group for comparison.
Note: If you do not clone the KPIs and simply place the KPIs in additional KPI groups, any changes made to the original KPI will trickle down to each instance of that KPI being displayed. Keep in mind, though, that trend data does not transfer to a cloned KPI, so it will take some time for the KPI to actually gain enough trend data to run the KPI Trend Comparison Report.
- Display Order: Next, you'll want to set the Display Order for KPIs to be compared on the same graph to the same value. For example, to display your Work Order Completion KPIs for the Facilities and Fleet on the same graph, you'll want to set the Display Order to "1" for both of these KPIs.
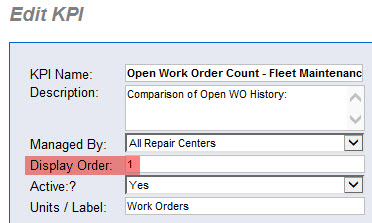
That duo will then be used to create the first graph on your report. Additional KPIs may be added to any set by simply setting their Display Order to the same value as the set you would like to compare them with. To form the next graphs, simply select the KPIs to be compared in that set and set their display value to "2," then "3" and so on.
Running the Report
You've got all the back end configuration in place and you're ready to see it in action! To make sure it displays the data you want, you'll need to add a few pieces of information into the Criteria.
- Name (text box): Type the name of the KPI Group you've created to house your KPIs for comparison.
- Date Stamp (drop-down): Next, you'll specify an amount of time for which to pull data. You'll find similar choices to other date drop-downs in the Report Criteria.
- UDFDate1 (drop-down): This feature allows additional information to be added to the report by pulling in notes from the Attach tab of the Repair Center. Any date range selected here will not alter the KPI data displayed, but will only filter the notes displayed on the report by date.
Note: Using a non-US date format in your System Preferences will cause an error when running the report. There is currently a Product Suggestion in place to resolve this issue, but unfortunately there is no workaround available at this time.
Installation Instructions
Now that you have an idea of what the report can do for you, you're probably asking, "How do I get my hands on this awesome tool?" This next section will help answer that.
On Premise: If your organization hosts its own database on your servers, your IT personnel or someone with server access will need to follow the below instructions:
- Place both the chart_series_TrendComp.asp and the rpt_KPITrendComparison.asp files in your Reports folder (typical path: ..\Maintenance Connection\mc_iis\mapp_v12\modules\reports).
- Open the SQL file for the report: KPI_Trend_Comparison.sql
- Copy contents into a new Query window in your SQL Server Management Studio (SSMS).
- Execute SQL script against your MC entity database prefixed with ENT.
- Once installed, you can locate your new tool in the System folder of the Base Groups, or by searching for "%trend" under All Reports.
Cloud Hosted: Based upon your database being hosted in our Data Center, you will need to make a request through our Support team to install the report.
Final Thoughts
We hope this report helps with your data analysis as you compare your KPI trends. If you would like some additional assistance interpreting the results or making any decisions regarding the configuration of your Key Performance Indicators, we strongly recommend spending some time with an Implementation Consultant.
We hope these reports help you get even better reporting data out of Maintenance Connection. For more content on Reporter basics, or for more advanced training in the Reporter, please check out the remaining articles in this section of our Knowledge Base.
SQL DISCLAIMER: The SQL scripts in this article has been written for the purpose described in the associated documentation. No Changes should be made to the SQL scripts. If you have any questions please contact the Support team before running.